I want to start by saying this clearly: I still believe Bitcoin is in a bearish regime.
Not a “healthy correction.” Not a “dip to buy blindly.” A proper, structurally bearish phase.
And yet — despite that — I’m also starting to think we’re getting closer to a zone where the odds quietly begin to shift. Not because price looks good — It doesn’t. But because when I step back, strip away the noise, and look at price behavior, liquidity, statistical deviation, and on-chain data together, I keep arriving at the same conclusion:
Bitcoin may be approaching a meaningful market floor — probabilistically.
This isn’t a call for a V-shaped reversal. It’s an attempt to understand where downside risk realistically runs out.
Let’s Be Honest About the Regime We’re In
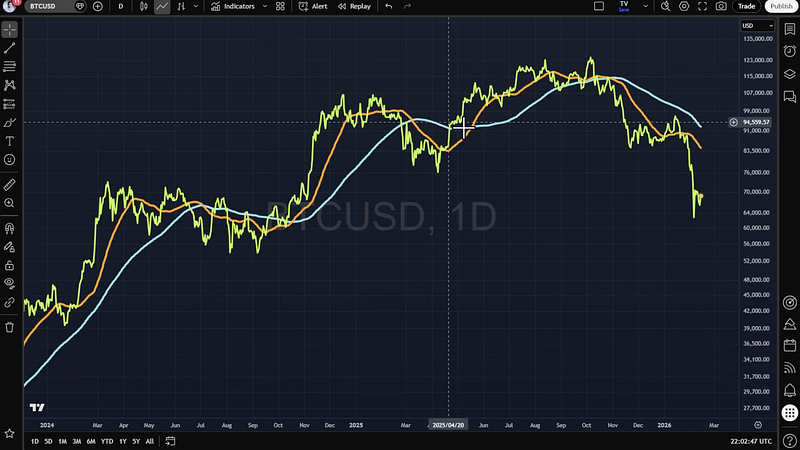
Bitcoin is not in an uptrend — It hasn’t been for a while — since last Oct (just like I called it 🙂)
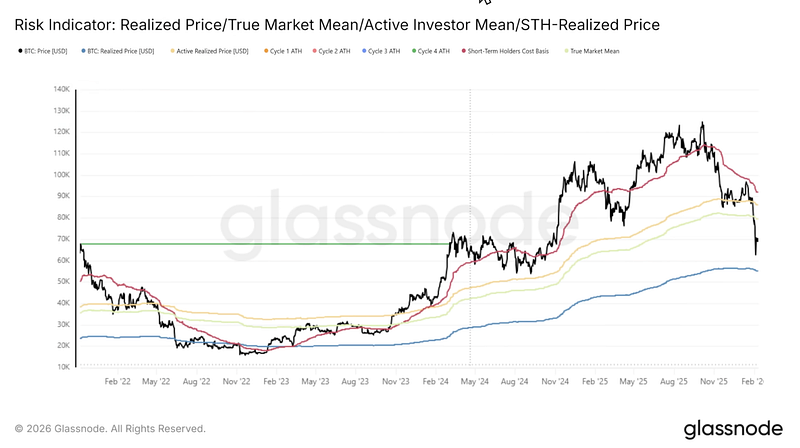
Price is currently below the 200-day MA, below the yearly MA, and below the short-term holder realized price.
That combination matters.
Historically, when Bitcoin trades below all three at the same time, the path of least resistance is down.
This exact setup mirrors what we saw in 2022. And before that, in late 2018. That doesn’t mean history repeats perfectly. But it does rhyme loudly enough that ignoring it would be reckless.
So I’m not looking for bullish narratives here. I’m looking for downside boundaries.
The Volume Void Below $90K Is the First Red Flag
One thing that really stands out to me is the volume profile.
There is a massive volume void below the $90,000 region. And volume voids don’t behave politely. When price enters them, it doesn’t drift. It moves fast — because there’s very little historical trading activity to slow it down.
This explains why recent sell-offs felt violent. There simply wasn’t much liquidity sitting underneath the price. And when I map out where real liquidity actually exists, one zone dominates everything else.
The largest volume cluster sits between roughly $57,000 and $72,000.
That’s where the market previously spent real time. That’s where buyers and sellers actually agreed on value. Markets love memory. They love revisiting areas of acceptance.
Which is why I find it extremely difficult to believe Bitcoin forms a durable bottom above this range. If we’re going to stabilize, it likely happens inside this zone.
The Z-score probability wave model, which measures how statistically stretched the price is relative to history, recently hit its most extreme downside deviation ever recorded.
That level came in around $60,000.
Let that sink in.
Statistically speaking, Bitcoin had never been that far below its expected historical range.
That doesn’t mean price cannot go lower. But it does mean that every dollar below that level carries dramatically less incremental downside probability.

The Risk Model Is Quietly Saying the Same Thing
The logarithmic risk model tells a similar story.
Risk dropped from about 31% to 18% as the price fell. Historically, that’s the zone where long-term opportunity begins to quietly appear.
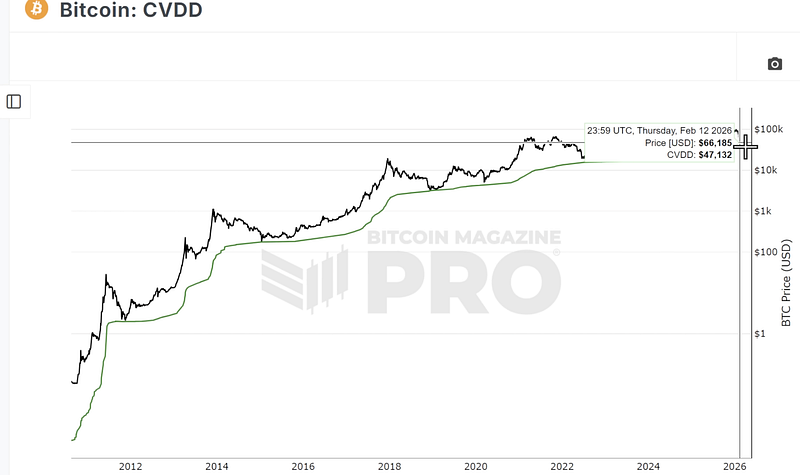
The model’s theoretical minimum risk — near 0% — aligns with a price around $48,000.
That number also converges with other independent data.
Right now, about 55% of Bitcoin’s supply is still in unrealized profit.
That means 45% is underwater.
Every major bear market bottom formed when roughly 40–50% of supply was in profit. We’re not there yet — but we’re close enough that I’m paying attention.
Historically:
2015 bottomed around 40–45% in profit
2018–2019 bottomed around 40–45%
2022 bottomed slightly higher, around 45–50%
When I line up:
Volume profile clusters
Z-score statistical extremes
Logarithmic risk levels
On-chain unrealized profit metrics
They all point to the same broad zone: $47,000 to $55,000
It’s a probability band.
Within that range, risk compresses rapidly while long-term upside remains asymmetrically large. That’s the definition of a zone worth caring about.
Bottoms Don’t Explode Up — They Grind You Into Submission
Bottoms are not cinematic. They’re boring, choppy, and demoralizing.
They involve:
Sideways price action
Failed rallies
Repeated tests of the same range
Declining volatility
Everyone getting tired
If Bitcoin enters the $57K–$70K volume cluster, I expect time to do the work, not a sudden reversal. That’s frustrating. But it’s also how durable bases form.
Timing the Exact Bottom Is a Trap
I have no interest in calling the exact low. That game is for egos, not portfolios. What I care about is probabilistic positioning.
If price trades into a zone where:
Statistical deviation is extreme
Risk models are near historical lows
On-chain supply stress matches prior bottoms
Then, missing the absolute bottom by a few percent simply doesn’t matter. The asymmetry does the work.
If Bitcoin trades into the low $50,000s, I’m comfortable accumulating aggressively — not because I think pain is over, but because the math finally starts working in my favor.
I fully expect frustration. I fully expect volatility. I fully expect boredom. But I also recognize that this is exactly how every major long-term opportunity has looked in hindsight.

Final Thought
Markets don’t bottom when things feel hopeful. They bottom when conviction evaporates, and data quietly stabilizes.
Right now, Bitcoin still looks weak. But underneath that weakness, something is changing.
Probability.
And that’s the only thing I care about at this stage of the cycle.
Found this article insightful?
It would mean a lot if you could give it a clap and follow for more financial alpha, which “influencers” are too lazy to study and share.🌟
Follow me on Twitter/X to stay always up to date.