Here’s how I’ve been thinking about this cycle lately, and honestly, it’s changed the way I look at Bitcoin drawdowns entirely.
For years, I’ve watched people obsess over tops, bottoms, narratives, macro headlines, and “this time is different” arguments.
I’ve done it myself.
But the deeper I go into on-chain data, the more I’m convinced that most of that noise distracts from one uncomfortable truth: markets don’t bottom when people expect them to — they bottom when people are exhausted.
That’s where this idea of a limit of exhaustion really clicked for me.
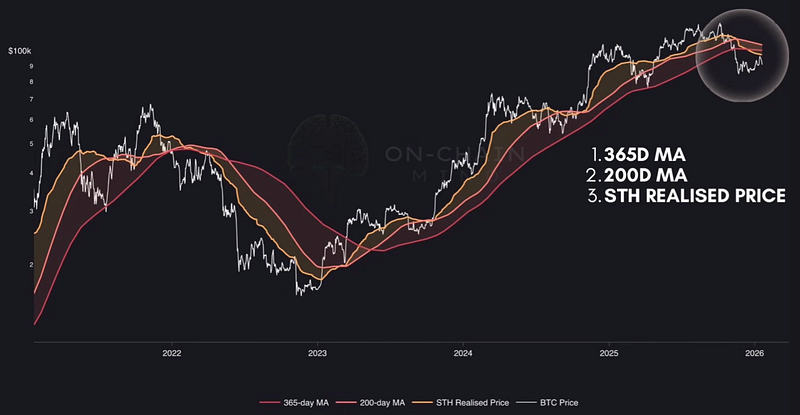
The One Level That Actually Matters to STH
There’s a price level most people never talk about, yet it quietly controls the emotional state of the entire market. It’s called the short-term holder realized price.
All this number does is track the average acquisition cost of Bitcoin that has moved in the last ~155 days.
In other words, it represents the cost basis of newer market participants — the group most sensitive to price moves, most prone to panic, and most likely to sell at the worst possible time.
When Bitcoin trades above this level, short-term holders feel smart. They’re in profit. They hold. They even buy more.
When Bitcoin trades below it, everything changes.
Suddenly, these participants are underwater. Loss aversion kicks in. Impatience builds. Every small bounce feels like a chance to escape rather than an opportunity to compound.
This is where the market starts grinding people down psychologically.

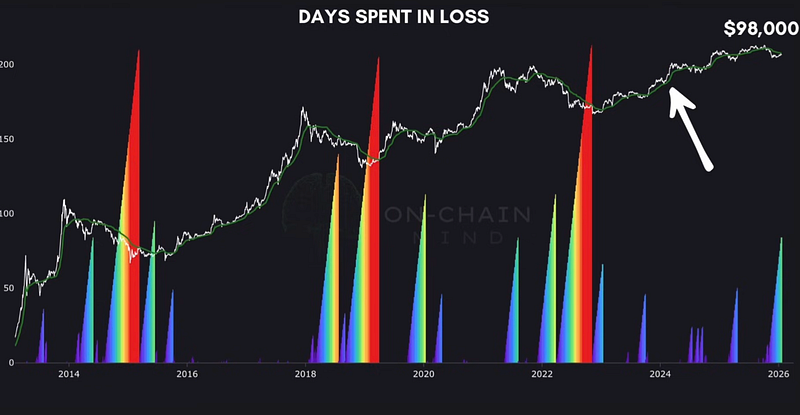
“Days Spent in Loss” Is A Powerful Signal
Instead of asking how far price has fallen, this framework asks a much better question:
How long have short-term holders been forced to sit in losses?
That’s what the days spent in loss indicator measures. It simply counts how many consecutive days Bitcoin’s price stays below the short-term holder realized price.
No opinions. No narratives. Just time.
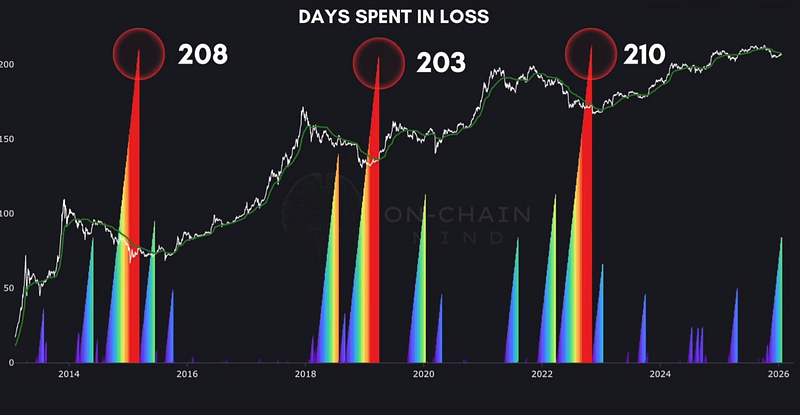
And time, it turns out, is what breaks people. Historically, this indicator has been eerily consistent.
In 2015, Bitcoin spent 208 days below the short-term holder realized price before finally bottoming.
In 2019, it was 203 days.
In 2022, it stretched to 210 days.
Different macro environments. Different participants. Different headlines. Same human psychology.
That alone should tell you something important: markets may evolve, but behavior doesn’t.
Capitulation Isn’t About Pain — It’s About Patience Running Out
One thing I’ve learned watching these cycles is that capitulation isn’t always a violent crash.
Sometimes it’s worse.
Sometimes it’s a slow, grinding bleed where nothing works, rallies fail, and people simply stop caring.
The “days spent in loss” metric captures that perfectly. It’s not measuring fear spikes. It’s measuring endurance.
How long can short-term holders tolerate being wrong?
There are two key exhaustion zones that show up again and again.
The first is around 100 days — This tends to mark a partial capitulation. Enough weak hands give up that selling pressure eases temporarily. Relief rallies often follow.
The second is closer to 200 days — That’s where full capitulation usually happens. That’s when almost everyone who can sell has already done so.
Only then does the market truly reset.
Where Are We Right Now?
At the moment, Bitcoin has spent 84 consecutive days below the short-term holder realized price, which sits around $98,000.
That tells me a few important things.
First, we are clearly in a capitulation phase, not at the start of a new bull leg. Short-term holders are underwater. Stress is real. Selling pressure is coming from impatience, not euphoria.
Second, we’re not at historical exhaustion yet.
Eighty-four days is meaningful, but it’s not enough to fully wash out weak hands.
From here, two scenarios matter.

Scenario One: The 100-Day Capitulation
This is the outcome I currently lean toward.
In this case, Bitcoin stays below the short-term holder realized price for roughly another two weeks.
That pushes us past the psychologically important 100-day mark.
At that point, enough short-term holders have capitulated that selling pressure dries up. The market stops going down not because everyone turns bullish, but because there’s simply no one left willing to sell at a loss.
Price then starts to reclaim the short-term holder realized price. Confidence slowly rebuilds. The market consolidates around that level.
That’s exactly what happened in 2019.
Not a V-shaped recovery. Not instant euphoria. Just a slow transition from despair to indifference — and eventually to optimism.
Scenario Two: The 200-Day Grind
The second scenario is darker but still very real.
If price fails to reclaim the short-term holder realized price after the 100-day mark, the market can enter a much longer exhaustion phase.
That’s when patience truly breaks.
Sideways price action. False rallies. Repeated breakdowns.
This is where people don’t rage-quit — they just quietly leave. Historically, this phase has lasted up to 200 days before a durable bottom forms.
It’s not dramatic. It’s boring. And that’s exactly why it works.
Why I’m Leaning Toward the Shorter Path
Despite everything, I don’t think this cycle needs a full 200-day washout.
The structure looks closer to 2019 than 2015 or 2022.
Back then, we had a slow bleed, not a catastrophic collapse. Liquidity conditions eventually improved. And once the market reclaimed the short-term holder realized price, it didn’t look back.
Right now, macro conditions are not perfect, but they’re also not tightening aggressively. Liquidity is stabilizing rather than collapsing. That matters.
More importantly, the market has already spent enough time below key psychological levels to do real damage to short-term conviction.
That’s the ingredient most people underestimate.
The Psychological Reset After Capitulation
What happens after capitulation isn’t fireworks.
It’s something quieter.
Short-term holders who sold swear they’ll never touch Bitcoin again. Longer-term participants stop checking the price every hour. Volatility compresses.
And then, almost without warning, price starts behaving differently.
Dips get bought. Rallies hold. The short-term holder realized price flips from resistance to support.
That’s not magic. That’s simply the absence of forced sellers.
This Framework Matters More Than Narratives
What I like about this approach is how brutally honest it is.
It doesn’t promise certainty. It doesn’t pretend to predict exact dates. It doesn’t care about headlines.
It asks one simple question:
Have the most emotional participants had enough time to give up?
Right now, the answer is: not quite — but we’re getting close.
How I’m Personally Thinking About This
I’m not trying to call the exact bottom. I’m not waiting for a single perfect signal. What I am watching is time.
Time below the short-term holder realized price. Time spent wearing people down. Time spent flushing impatience out of the system.
That’s how Bitcoin bottoms have always formed.
Not when everyone agrees it’s cheap. But when everyone is tired of caring.

Final Thoughts
Every cycle convinces people that structure has changed, that psychology no longer applies, that this time is different.
And every cycle proves the opposite.
The days spent in loss framework works because it’s rooted in something that never changes: human behavior under stress.
Bitcoin doesn’t bottom when fear spikes. It bottoms when fear gets boring.
We’re not there yet.
But for the first time in a while, we’re close enough that it’s worth paying attention — not emotionally, but probabilistically.
And that, in my experience, is where the real edge begins.