Lately, Bitcoin has felt noisy.
Not in the euphoric sense. More like the kind of noise you get when everyone is talking past each other, clinging to one indicator, one level, one narrative, hoping it tells them what they want to hear.
I kept seeing the same questions pop up everywhere: Is this the bottom?
Is the MACD crossing the start of the next leg up? Are we about to rip back to all-time highs?
Instead of looking at any of that emotionally, I did what I usually do when things feel murky. I slowed everything down. I pulled up the higher timeframes.
And I let the indicators speak — not individually, but together.
What came out of that process was something much more grounded. A market that is still structurally weak, potentially capable of short-term bounces, but not yet showing the kind of evidence that supports a full trend reversal.
Let me walk you through how I’m thinking about it.


First, the Macro Market Environment Matters More Than Any Single Indicator
Before even touching Bitcoin’s chart, I looked at what’s happening around it.
Volume is back. That’s obvious.
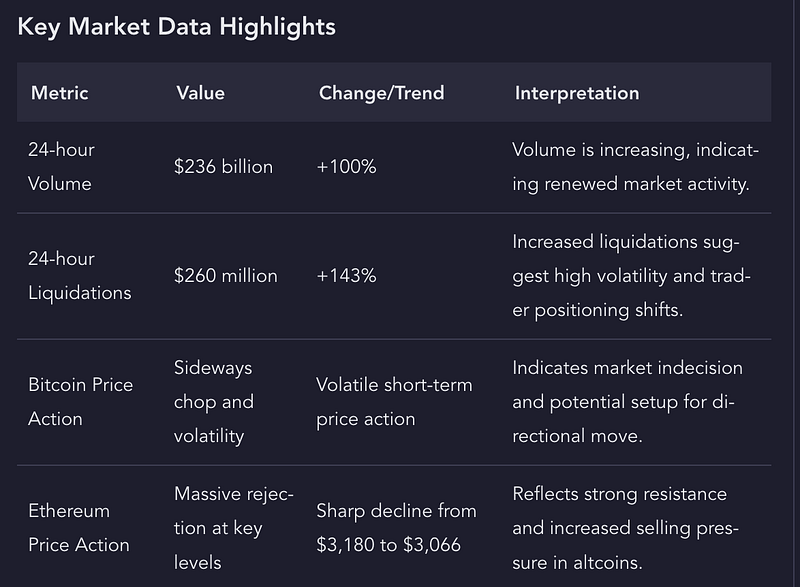
Twenty-four-hour volume has surged to roughly $236 billion, up nearly 100%.
Liquidations have exploded past $260 million in a single day, up over 140%.
On the surface, that looks like “action.”
But volume and liquidations don’t tell you direction. They tell you stress.
Stress means traders are repositioning, getting stopped out, flipping bias, or being forced out entirely. That usually happens near inflection points — not confirmations.
Ethereum tells a similar story. A sharp rejection from the $3,180 area down into the low $3,000s isn’t strength. It’s sellers stepping in aggressively at known resistance.
So right away, the broader context is this: Volatility is back, emotions are high, but conviction is missing.
That’s the backdrop everything else needs to be read against.

The Macro Backdrop Isn’t Helping Bitcoin Right Now
Zooming out even more, two external charts matter a lot here: the DXY and the S&P 500.
The U.S. Dollar Index is sitting just below the psychologically important 100 level. And this is where things get interesting.
If the DXY breaks above 100 and holds, the structure starts to resemble an Adam and Eve formation — a pattern that often precedes a stronger push higher. A move toward 103–104 wouldn’t be surprising in that scenario.
And that matters because Bitcoin has never liked a strengthening dollar.
Risk assets, especially speculative ones, tend to struggle when the dollar regains momentum.
Meanwhile, the S&P 500 is potentially forming a rising wedge. That’s a pattern I don’t like ignoring.
Rising wedges look bullish until they aren’t. They usually resolve downward.
And if equities roll over, Bitcoin rarely decouples in a positive way during those phases.
So from a macro perspective, Bitcoin is not getting a tailwind right now. At best, it’s fighting a neutral backdrop. At worst, it’s pushing into growing headwinds.
The MACD Cross Everyone Is Talking About Isn’t the Signal People Think It Is
Let’s address the MACD, because this is where a lot of narratives are being built.
Yes, a bullish MACD cross is forming. Yes, historically MACD crosses can precede rallies.
But context matters more than the cross itself. Right now, both MACD lines are still below zero. That means momentum is negative.
A cross below zero does not signal a new bull market. It signals a potential relief rally inside a bearish structure.
We’ve seen this movie before. Multiple times during past bear markets, Bitcoin printed MACD crosses below zero that led to short-lived bounces — followed by continuation lower.
Even the histogram tells the same story. Red bars are shrinking, which means bearish momentum is weakening. But weakening bearish momentum is not the same thing as bullish momentum returning.
This is where people get trapped. They see a cross and assume trend reversal. The data doesn’t support that assumption.
RSI Is at a Level That Demands Respect — But Not Blind Optimism
RSI is another indicator people love to oversimplify.
On higher timeframes, RSI has a level that acted as a multi-year divider between bull and bear phases.
When Bitcoin held above it, the price trended higher for years. When it lost that level, we entered bear markets.
Right now, RSI is retesting that same level from below.
That’s important. It means the price could bounce.
Historically, similar RSI retests have triggered short-term rallies. But they have not marked the beginning of new macro bull runs unless price reclaimed and held that level decisively.
In previous cycles, RSI breaks above this zone during bearish regimes led to relief rallies — and then failure.
So again, the signal isn’t “we’re going to new highs.”
The signal is: a bounce is possible, but failure is statistically more common here than follow-through.

The Ichimoku Cloud Is Reinforcing the Same Message
Ichimoku is one of those tools that doesn’t scream.
It whispers.
And right now, it’s displaying caution. A Kumo twist has formed ahead of price. That’s a leading signal, shifted forward by 26 periods.
Historically, when a Kumo twist appears during declining momentum, price often spends significant time chopping or moving lower before any sustained recovery happens.
Even more concerning is Leading Span B. Whenever Bitcoin has lost that level in the past, it has preceded deeper macro corrections.
At the moment, price is testing — or sitting below — that exact area.
That doesn’t mean “crash now.” It means risk remains elevated, and upside attempts lack structural backing.

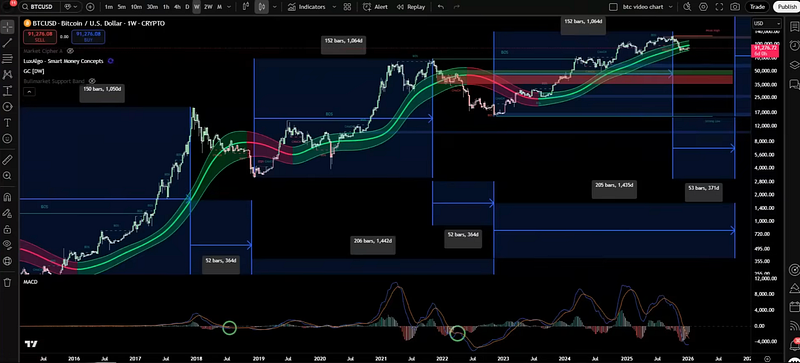
The 50 EMA and Gorsian Channel Are Acting Like a Ceiling
On the two-week chart, Bitcoin is retesting the 50 EMA.
That level has been pivotal across cycles. When price reclaims it with strength and momentum, bull markets expand. When price stalls there with negative momentum, rallies fail.
We’ve seen MACD crosses at the 50 EMA before — and when momentum was negative, they resolved lower.
The Gorsian channel adds another layer. Losing its lower boundary has historically aligned with macro corrections. Bitcoin is hovering near that boundary now.
Nothing about this setup says “buyers in control.”

Short-Term Price Action: Where a Bounce Could Happen — and Where It Must Happen
Zooming into the lower timeframes, Bitcoin is chopping sideways with sharp volatility.
That’s indecision. There is a clear horizontal resistance at $94,000. Until that level breaks and holds, upside is suspect.
If $94,000 breaks cleanly, I’d expect a move toward the $100,000–$104,000 zone. That would still be a counter-trend rally, not a confirmation.
The real line in the sand is $108,000. Only above that level does the structure shift back into buyer control.
Below it, rallies remain rallies — not trends.

So What Does All of This Actually Mean?
Putting everything together, here’s how I’m framing it in my own head.
Bitcoin is not collapsing, but it is also not signaling a bull market anymore since the Oct’25 month. Momentum indicators are improving slightly, but from deeply negative territory. Macro conditions are neutral at best. External markets are flashing warning signs.
This is the kind of environment where relief rallies happen — and trap people who confuse them with reversals.
Could we bounce? Yes.
Could we rally toward $100K? Also yes.
But unless Bitcoin reclaims key structural levels with strong momentum, the broader trend remains vulnerable. And that’s the part I don’t think enough people are respecting right now.
I’m not bearish because I want the market to go down. I’m cautious and bearish because the evidence tells me to be.
Every major indicator I’ve looked at — MACD, RSI, Ichimoku, moving averages, channels, macro correlations — is telling the same story from different angles.
Short-term opportunity exists. Macro confirmation does not.
That doesn’t mean panic. It means patience. It means treating bounces as trades, not beliefs. And it means waiting for the market to provestrength instead of assuming it.
Bitcoin has taught me one thing over the years: It rewards discipline far more than hope.
And right now, discipline means respecting the data — even when it’s uncomfortable.